Available as a full pdf with references from above.
1. Introduction
The year of 2013 represents a milestone in the history of Association football1 with the sport’s founding organisation, The Football Association (FA), celebrating 150 years in operation.
Its nascent rules were based on variations of the game that had emerged in English public schools in the 19th century. By 1885, the appeal of football had grown exponentially and the FA sanctioned the payment of players (Taylor, 2007). Professional football had been born.
The professional era meant there was a requirement for greater ownership organisation in football clubs. Birmingham City became the first club to adopt ‘limited liability’ status in 1885, which has become the status quo in the modern game (Dobson and Goddard, 2011: p. 187).
Under regular business premise, the underlying objective of a company is to maximise shareholder wealth (Franks and Harris, 1989). Local business figures began to assume control of their native clubs but for mostly kudos rather than financial gain. It was not until the foundation of the English Premier League (EPL) in 1992 that English football clubs became potentially capable of generating substantial returns for their owners (Conn, 2002).
The five year £305m Sky satellite broadcasting contract that coincided with the formation of the EPL acted as a financial catalyst for monetary growth for football in the UK (Bell et al., 2013). Consequently, a large number of football clubs listed on stock exchanges as a means to raise finance to be spent on infrastructure and creating on-field success.
This lead to a short-term spending spree amongst clubs causing significant inflation in players’ transfer fees and wages meaning there was little or no dividends to be paid to shareholders in most instances. High floatation costs, stagnant shares (mostly held by majority shareholders or individual supporters) and the lack of interest from institutional investors caused most clubs to eventually de-list (Bell et al., 2012).
However, by 2011 the EPL had become Europe’s leading domestic league with a global following and a combined club turnover of £2.27bn based on the development of key revenue streams such as: advertising, catering, corporate hospitality, gate receipts, media income, merchandising, prize money,
sponsorship and stadium naming rights deals (Jones et al., 2012).
The league’s latest media rights deal that will run for three seasons from 2013 is worth £5.5bn and will see live games broadcast in 211 countries. The vast amount of money within the EPL has attracted potential investors from all over the globe as well as domestically (Harris, 2012).
In the five years between 2005 and 2010, twelve Premier League clubs changed hands and by 2012 eleven of the division’s twenty clubs were controlled by foreign owners (Blitz, 2012). Despite the dramatic increase in club acquisitions in recent years, it has become apparent that finance professionals within the football industry use vastly differing methods to ascertain a club’s value.
This is illustrated in the example below of Tottenham Hotspur, which was listed on London’s Alternative Investment Market (AIM) until January 2012.
Anomalies in football club valuation – Tottenham Hotspur 2012:
Market Capitalisation Value £83.6m2
Revenue Multiples Value £245.2m3
Forbes Value £351.1m4
The aforementioned estimates lead one to consider, which figure, if any, is correct? A potential investor’s judgment will unquestionably be impaired by the significant discrepancy of £267.5m between the highest and lowest club valuations outlined above.
This was the underlying motivation for this paper which analyses the methodologies available for football club valuation. Comprehensive academic literature exists pertaining to valuation in almost every strand of finance. That said, research into the valuation of sporting organisations is limited and almost every study in the area focuses on North American sports franchises which operate in very different conditions to football clubs in England.
The primary differences between North American sports and football in England is that in America: there is no relegation, player earnings are capped, there is a draft system for players which allows the worst performing teams to acquire the best talent, television and merchandising
revenue is shared equally among franchises and there are strict rules about setting up franchises in close proximity to each other. The aim of this paper is to reveal the optimal method to value a football club focusing on the EPL market.
The remainder of the paper is organised as follows. Section 2 examines the existing relevant literature and is split into two parts – first, the benefits and drawbacks of traditional corporate valuation techniques are discussed in a football context.
Second, material on contemporary football club valuation techniques is reviewed and compared to traditional approaches. Section 3 reveals the sources of data and methodology employed to calculate each valuation technique.
Section 4 presents and explains the rationale behind the new multivariate valuation model introduced in this paper. Section 5 analyses the results of the various valuation techniques applied to EPL clubs during the sample period. Finally, Section 6 concludes.
2. The Existing Literature
Asset valuation is the lifeblood of financial world. The underlying outlook of all rational investors is to continuously optimise their investments.
This is done primarily through analysing market efficiency to determine if undervalued assets exist that can be exploited. Therefore, being able to value an asset properly is imperative to every rational investor. This sentiment is no different when it comes to investing in a football club.
Academics and professionals within the domain of finance use a vast array of models and methodologies to determine the value of projects and companies.
These models range from the extremely basic to the highly complex. They occasionally are based on extremely contrasting assumptions in a bid to ascertain what an asset is ultimately worth. So what is the most credible valuation method and is it applicable to EPL clubs?
2.1 Traditional corporate valuation techniques
This section examines three valuation methods that have traditionally been used in the corporate finance sphere to establish a company’s true value.
2.1.1 Market capitalisation
Only a company floated on an exchange where equities regularly change hands at arm’s length can be valued reliably using market capitalisation.
It is a simple calculation whereby a company’s share price is multiplied by the number of shares in issue to provide the market capitalisation or company valuation (Bolton and Von Thadden, 1998).
It is typically larger companies that choose to raise capital through floating on an exchange due to the high cost of preparing a prospectus for potential investors as well as underwriting the equity issuance.
A number of London based indexes exist that are specifically designed for companies with a smaller turnover such as the Alternative Investment Market (AIM) or the ICAP Securities & Derivatives Exchange (ISDX) (formerly PLUS and OFEX). That said, adherence to stringent stock exchange rules and annual reporting requirements remains an extremely costly process (Brealey and Myers, 2002).
Stock exchange disclosure requirements may also hinder the strategic objectives of a football club. One such example of this is that a listed club would have to declare to the stock exchange if negations to sign a star new player were taking place whilst a non-listed club would not.
These are the primary reasons why only five UK clubs are currently listed or partially listed on an exchange. This compares to twenty clubs in 2002 (Bell et al., 2012).
Companies with liquid shares in efficient markets tend to be valued appropriately as quoted share prices are realisable for investors (Modigliani and Miller, 1958). Market sentiment influences share volatility.
In the case of listed football clubs, shares have tended to be stagnant and illiquid resulting in share prices that do not reflect the true value of clubs being quoted. This was illustrated in the previous section with Tottenham Hotspur’s market capitalisation of £83.6m prior to delisting in 2012 when the club was worth considerably more than this.
Shareholder structure within publicly quoted companies may impact a potential acquisition and valuation (Damodaran, 2012).
In some instances, including the aforementioned Tottenham Hotspur example, majority shareholders’ will have no interest in selling at any price but usually investors looking to gain control of a company are likely to have to pay a significant premium on top of a share’s current value in order entice shareholders to sell (La Porta et al., 2002).
2.1.2 Discounted Cash flow (DCF) models
The DCF valuation method is recognised as the most credible means to value assets or companies by both academics and practitioners alike (Demirakos et al., 2004).
Using this technique the value of an asset is calculated by obtaining the present value of the expected future cash flows. These cash flows are discounted back to the present day using a discount rate in-line with the perceived risk of the investment (Pratt, 2008).
Unlike market capitalisation, which can only value companies listed on an exchange, DCF can value any company that has predominantly positive and predictable cash flows going forward. Traditionally, the future cash flows of a company are dividends distributed to investors.
The version of DCF that discounts back future dividends is known as the Dividend Discount Model (DDM). Problems can arise when deciding the correct discount rate for a valuation. Invariably, the higher the discount rate, the riskier the asset or investment. More complex versions of DCF were developed specifically to value firms. Under this method a company’s value is attained by discounted future free cash flows5 (Damodaran, 2012).
Although DCF represents the purest technique to ascertain the value of a business, it is flawed when valuing a football club (Thornton and Matyszczyk, 2010).
The primary reason for this is that most football clubs in the UK are perpetually loss making entities and therefore do not have any positive future cash flows to discount back to today’s value. Eight Premier League clubs made a profit in 2011 which was a notable year by the standards of the league (Jones et al., 2012).
Also, traditionally very few clubs pay dividends so the DDM could not be used to compare clubs on a consistent basis.
2.1.3 Bankruptcy valuation
The process of corporate bankruptcy takes one of two forms in the UK dependant on its severity, administration or liquidation. This process is regulated by the Insolvency Act 1986 (amended in 2000 and 2010) and the Enterprise Act 2002 (Singh, 2010).
An administrator who oversees the entire course of action for the company may be appointed voluntarily through the company’s directors or by an entity holding a floating charge against a company’s assets. A court petition is required for an administrator to be appointed to a company if creditors do not hold a floating charge (Brouwer, 2006).
The objective of the company administration process is to give the organisation time to restructure its operations and continue as a going concern which is likely to be of benefit to its creditors in the long term. In the instance that administrators believe that a company will be able to operate as a going concern, liquidation is the next step with its assets sold to cover all or a proportion of outstanding debt (Derbyshire et al., 2009).
Fifty six English league clubs have entered administration since the inception of the EPL in 1992 (Jones et al., 2012). Unlike regular companies, football clubs need to exit the administration progress through a Company Voluntary Arrangement (CVA) where at least 75% of creditors agree to terms they have been offered. If this is not the case a club will suffer a further 15 point deduction on top of the standard 10 point administration deduction at the beginning of the following league season (Conn, 2008).
In contrast to regular companies, the appointment of an administrator to oversee a football club’s finances rarely ends up with the club entering liquidation.
Former Scottish Premier League (SPL) side Gretna FC is the only high profile UK club to be dissolved in recent years following the sudden death of its core patron, Brooks Mileson, in 2008 (Glen, 2009).
There are a number of examples of debt crippled clubs re-forming as a new company including another former SPL club, Glasgow Rangers, in 2012 (Morrow, 2012). One can assume that the lack of football club liquidations is due to the status, identity and passion a club brings to its local area and community.
In the lower tiers of football in the UK, local people have shown time and time again that they are willing to support their clubs in times of financial difficulty. Traditionally, administrators do their upmost to keep any football club under their stewardship operating as going concern.
Clubs in this situation are usually valued at the minimum amount a club’s total creditors agree to accept through the administrator (Scott, 2007). Administrators may also value a football club by combining its debt with the value of its asset base.
They will hire an independent expert to value any assets including property surveyors to value its real
estate fixed assets and football agents to value its playing squad according to David Hinchliffe6, a prominent insolvency practitioner who has previously negotiated the administration process successfully with Bradford City, Huddersfield Town, York City and Leeds United.
2.2 Contemporary football club valuation techniques
This section outlines and evaluates the specialist methodologies used within the football sector to ascertain a club’s worth.
2.2.1 Revenue multiples approach
The use of revenue multiples to value what a company is worth is advocated by a number of academics and practitioners. As the name suggests, it measures a company’s value relative to its turnover. It is a simple technique typically used to value a younger or troubled businesses that cannot be valued by more technical traditional means.
The method is also suited to industries with volatile earnings (Damodaran, 2012). It is therefore particularly appealing to football club valuation as DCF requires sustained and predictable profitability which few clubs can provide whilst revenue multiples only requires a turnover figure (Thornton and Matyszczyk, 2010).
The valuation is calculated by multiplying an organisation’s annual revenue by the appropriate multiplier. Deloitte Sports Business Group recommends the use of DCF analysis in corporate valuation but acknowledges that this method is flawed when it comes to calculating the value of some clubs.
The group’s Partner, Dan Jones, describes the valuation of a football club as being ‘as much of an art as a science’ (Harris, 2006). Nevertheless in the 2008 edition of its Annual Review of Football Finance Deloitte reported that EPL ‘clubs have typically cost the equivalent of between 1.5 and 2.0 times annual revenue’ (Jones et al., 2008). This research was based on the actual purchase prices of the nine Premier League clubs sold between 2003 and 2008 and intended to be an approximate valuation method enabling quick calculation. The primary shortcomings of revenue multiple valuation is that it does not reflect a club’s assets, debt, ability to control costs and generate profits.
2.2.2 Forbes valuation
Forbes has been publishing valuations for the top North American sports franchises competing within the Major League Baseball (MLB), National Basketball Association (NBA), National Football League (NFL) and National Hockey League (NHL) since 1998. In 2004, the wealth orientated magazine began publishing its ‘Most Valuable Soccer Teams’ which revealed the twenty most valuable football clubs in Europe (Maidment, 2004).
The now annual Forbes feature lists the twenty-five highest valued football clubs in the world based on the magazine’s own valuation methodology.
Historically, the technique favoured by Forbes in valuing clubs was based on multiples of revenue, past transaction prices and a club’s current stadium status. If a club was scheduled to move into a new stadium which will potentially increase its annual revenue, this is factored into the valuation estimate (Forbes, 2003).
The 2012 valuations are based on an even vaguer model that starts with Deloitte’s Football Money League7 figures from which Forbes engages in its ‘own research which includes reviewing financial documents and speaking to sports bankers, to derive operating income, debt and values for each team’ (Ozanian, 2012).
The evidence above elucidates that revenue multiples play a large part in Forbes’ club valuations.
Their figures may be comparable on an annual basis but the logic of valuing a sports franchise predominantly based on revenue figures is flawed (Vogel, 1999).
This is apparent when Forbes North American sports franchise valuations between 1998 and 2003 were compared with the actual transaction price of the same sports franchises sold during the period. Results show that on average the transaction cost of the franchises was 27% higher than Forbes had estimated during the aforementioned period (Vine, 2004).
A comprehensive study of the sale of 91 North American sports franchises since 1990 found that Forbes and Financial World8 valuations were on average $31.6m (£20.7m) less than the actual price the franchises sold for. Of the 91 sales; 57 were valued at less than the actual sale price with the average difference of $75m (£49.2m).
The average difference for 30 of the sales was $49m (£32.2m) higher than the actual price paid with the remaining 4 sales being close to the agreed transaction price (Humphreys and Mondello, 2008).
2.2.3 Broker valuation
Countless brokers operate in the financial sector to arrange the sale of just about any commodity between a buyer and seller.
Brokers are particularly prevalent in the equity and money markets. There is also a niche market for the sale of professional football clubs. Since the inception of the EPL, the vast majority of club transactions have been brokered by former Football League Chairman, Dr Keith Harris of Seymour Pierce (White, 2008).
Brokers often look at fundamentals when trying to ascertain the value of the asset they are trying to sell. In the case of a company, the first port of call is its annual report. The balance sheet of audited accounts provides the user with the book value of the assets and the equity of the business whilst the profit and loss account reveals the current financial performance.
Many investors see this historical performance to be a more reliable metric than uncertain predictions of future performance (Damodaran, 2012). In the case of football clubs, there are two core fixed assets: tangible property (e.g. stadium or training ground) and intangible player registrations (which allow clubs to ‘own’ players).
Valuing property is straight forward but valuing player registrations is less so (Morrow, 1999). Registrations are usually amortised over the duration of a player’s contract with the initial book value based on the transfer fee paid for the player by the club.
Problems can arise when clubs try to value players that have come through their youth academy, those that sign new contracts at the end of their initial contract or if a club overpaid in the first place for a player (Amir and Livne, 2005 and Rowbottom, 2002).
Brokers also make use of credit ratings when assessing a sale. International ratings provider, Fitch, offers ratings for sports franchises but is primarily focused on the North American market (Lewis et al., 2007). Online credit information provider Equifax assessed the financial health of EPL clubs in 2009 and stated 11 of the league’s 20 sides were in financial difficulty but this metric has not produced on a consistent basis (Moore and Clark, 2009).
The reality of being a broker does not necessarily centre around the value of the asset they are selling but more on trying to drum up interest and create a bidding war. Like any asset, ‘a club is only worth what somebody is prepared to pay for it’ according to Keith Harris9. This could be higher or lower than its actual value depending on interest and economic circumstances.
3. Data and Methodology
3.1 Data Sources
The data employed in this research were collected from a variety of sources for the nine EPL sample seasons between 2003/04 and 2011/12. Financial data (turnover, profitability, assets and liabilities) were taken from individual clubs’ annual reports between 2003 and 2011.
The annual reports were obtained from Companies House. Club wage bills and stadium utilisation figures came from the Deloitte Annual Review of Football Finance publications between 2003 and 2012 (including Jones et al., 2012) which were also used to cross reference the clubs’ annual report figures.
The rationale for the selected sample period is that allows direct comparison with all the Forbes ‘Most Valuable Soccer Team’ listings since the feature was introduced by the publication in 2004. The valuations for 2004-2012 inclusive can be accessed at www.forbes.com.
It also represents an era dominated by overseas takeovers in the EPL. All foreign exchange rates used in calculations were attained from www.xe.com. Actual club transaction values for Premier League clubs that changed hands during the sample period were compiled from a variety of media sources made up of the Financial Times, The Guardian, The Telegraph, www.bbc.co.uk and www.swissramble.blogspot.co.uk. Historical club share prices and numbers of shares in issuance were taken from Datastream.
3.2 Methodology
The underlying rationale for this research is to determine what is the optimal method to value a football club. Consequently, there are two fundamental criteria that valuation methods need to meet in order to be considered: the first is that the technique needs to provide a reliable valuation and more importantly, it also needs to be universally applicable to football clubs in the EPL.
This section will outline the methodologies used to calculate the valuation methods introduced in the previous section of this paper.
3.2.1 Market capitalisation
Market capitalisation can only be used to value football clubs that are listed on a exchange. In 2013, there were only five clubs in the UK that were wholly (Arsenal, Celtic, Millwall and Rangers) or partially (Manchester United) floated on an exchange. Only two of these clubs, Arsenal and Manchester United, are part of the EPL.
There are a further seventeen professional football clubs listed on exchanges in Denmark, France, Germany, Italy, Sweden, the Netherlands, Turkey, Poland and Portugal10. This means that a little over 12% of clubs in the aforementioned leagues are listed and only therefore only a small minority of football clubs can be can be valued using market capitalisation.
In 2002, there were twenty UK clubs listed on various exchanges (Bell et al., 2012). Institutional investors bought significant numbers of clubs shares in anticipation of substantial returns on the back of large broadcasting contracts.
These returns did not materialise as clubs spent vast amounts on player transfer fees and wages. As a consequence institutional investors lost interest in football and shares became stagnant as most were either owned by a dominant owner or individual fans who had no interest in selling.
Illiquid shares often do not reflect their true value at they are traded so seldom. Despite this, the market capitalisation value for all applicable clubs has been calculated for comparison purposes in Table 1. The method used for calculation was the clubs’ share price on April 15 each year (the time of year that Forbes releases its club valuations) multiplied by the number of issued shares.
3.2.2 Discounted Cash flow (DCF) models
DCF is the most established method to ascertain the value of a project, asset or company. Broadly speaking, the method discounts expected future cash flows of a business back to the present to establish what the company is worth. There are four different variations of DCF.
The first version calculates a company’s value by discounting expected future cash flows of a business using a risk-adjusted rate. The riskier the investment, the higher the rate.
The second version adjusts expected cash flows for risk to get risk-adjusted cash flows that are then discounted back to the present value to find a company’s worth.
The third version is known as adjusted present value (APV) where a company is valued without debt before the positive or negative effect of borrowing is examined.
The fourth version values a company as a function of the excess returns it is expected to generate based on its investments (Damodaran, 2012).
Most football clubs, with the exception some larger clubs, are not as sophisticated as regular companies when it comes to financing.
On examination of EPL annual reports for the sample period, most clubs are financed by wealthy benefactors or a mixture of overdrafts and long-term loans from financial institutions.
Leveraged buyouts of clubs have occurred in recent years with mixed degrees of success. The Glazer family acquired Manchester United for £800m in 2005 and managed to cover interest payments as high as £108.6m in subsequent years due to the club’s unparalleled commercial operation (Conn, 2012).
Tom Hicks and George Gillett completed a leverage buyout of Liverpool in 2007 but were forced to relinquish control of the club in 2010 when interest payments could not be met (Scott, 2010).
The calculation of the Weighted Average Cost of Capital (WACC) is not universal amongst EPL clubs so a simpler form of DCF is required for comparison purposes.
The first problem encountered when applying a DCF method to value football clubs is consistent profitability. Traditionally, most EPL club are loss making entities.
And even for those that are profitable, it is extremely difficult to forecast financial results going forward given the unpredictable nature of the game.
Nevertheless, club valuations were calculated using DCF for all the clubs included in the Forbes Most Valuable Soccer Teams list that had positive cash flows. These values are included within Table 1.
The formula used for the DCF valuations was:
Like all DCF calculations a number of assumptions were made. The FCFF₀ figure used was the earnings before interest, tax, depreciation and amortization (EBITDA) taken from the annual report of each club for each relevant year.
No capital additions were made to these figures as clubs used different accounting treatments relating to how they account for player purchases (Amir and Livne, 2005).
The growth rate used is the 2013 rate of inflation in the UK, 2.7%11. The cost of borrowing used is 10% as this is the average rate EPL clubs are currently borrowing at (Jones et al., 2012).
3.2.3 Bankruptcy valuation
The administration and, ultimately, liquidation process of football clubs is something that cannot be simulated. Distressed organisations will often do whatever it takes in terms of asset sales to continue to function as a going concern. In the case of football clubs, this usually involves the sale of their core assets such as a stadium, training ground or players.
Administrators use professional valuers to ascertain what these assets may be worth but when cash is required quickly to survive they can often be sold at a lower amount than if the seller was not under financial pressure.
Only one club, Portsmouth FC, has ever gone into administration whilst in the EPL. Therefore, no administration or liquidation valuation estimates have been made for comparison purposes in this paper.
3.2.4 Revenue multiples approach
The use of revenue multiples to value football or sports clubs is advocated by academics and industry professionals akin to Deloitte and Grant Thornton.
The primary reason for this is because clubs do not need to be profitable to adopt the approach. This is the first method encountered that can be used to value all clubs and not just a select few that meet certain criteria.
For the purpose of the calculating clubs’ valuations, the multiple of choice for the results in Table 1 is 1.5 times the club’s annual turnover in-line with Deloitte’s recommendation in the 2008 Annual Review of Football Finance (Jones et al., 2008).
3.2.5 Forbes valuation
Forbes has been publishing its annual ‘Most Valuable Soccer Teams’ feature since 2004. In the nine years since then the list has included between six and ten EPL clubs dependant on the year. Forbes club valuations have consequently become the benchmark figures in club valuation by default.
The actual valuation methods used by Forbes are not available publicly. Consequently, Table 1 is made up of all the EPL clubs included in the Forbes valuations between the 2003/04 and 2011/12 seasons.
These tables compare the Forbes valuations to the four other methods under review in this paper. Tables 2, 3 and Fig. 1 compare Forbes valuations to actual transaction values of clubs sold during the same period.
The values were converted from USD to GBP using www.xe.com on 30 June12 for each year.
3.2.6 Broker valuation
A broker’s valuation of football club is broadly similar to that of an administrator except that a broker is usually employed to sell a club in a stable environment.
The broker will assess the assets and liabilities of a club before assigning a value or guide price for the club. Owners may also have a minimum reserve price that they are willing to sell at.
However, a broker’s main service does not necessarily centre around the value of the club. Their core objective is to create a bidding war and ultimately sell a club for the highest amount possible.
Therefore, similar to administration/liquidation valuations, broker valuations cannot be simulated and no estimates have been made for comparison purposes in this paper.
It became obvious over the course of this research that none of the aforementioned valuation methods were universally applicable and capable of providing a reliable value for every EPL club.
Consequently, it was decided to develop an alternative valuation technique capable of achieving these underlying objectives. To do this it was first needed to decide what components should be included in such a model and why.
The vast majority of scholarly research relating to club valuation stems from North America. A sports franchise’s ability to make money in the future ultimately determines its valuation. In the US market there three major statuses to consider: league, stadium and market.
The main league revenue considerations are: broadcasting revenue, merchandise revenue sharing policy and player salary cap. The primary issues with regard to a stadium centre relate to capacity, corporate boxes, sponsorship and advertising.
Finally, market demographics need to be considered for valuation purposes which include market size and corporate presence in the vicinity (Phillips and Krasner, 2010).
The majority of aforementioned factors are extremely relevant for EPL clubs too. However, the issues relating to revenue sharing and salary caps are not applicable.
Looking specifically at football, it is evident from the revenue multiples and Forbes approaches that a football club’s ability to generate revenue is important from a valuation perspective.
There are three core revenue streams for EPL clubs: broadcast revenue (52%), sponsorship (24%) and match-day (24%).
Unlike many of Europe’s largest football leagues, the EPL splits broadcasting revenue relatively evenly amongst clubs (based on television appearances and league performance) with the highest earning club in 2010/11, Manchester United, receiving £60.4m and the lowest earning club, West Ham United, getting £40.3m (Jones et al., 2012).
Revenue has taken on added importance in football given that clubs competing in European competition have to adhere to UEFA’s Financial Fair Play (FFP) regulations.
These stipulate that clubs can make a combined loss of €45m (£38.8m) over the three seasons between 2012/13 and 2014/15 (UEFA, 2012).
The regulations were introduced to encourage clubs to ultimately operate within the revenue they generate and have been followed up by the EPL adopting similar financial controls. Club revenue includes every means a club has of generating cash and is therefore included within the multivariate valuation model.
Controlling costs has been a major problem for EPL clubs in the past. Club revenues have grown by 267% between 1996/97 and 2010/11. Player wages, traditionally a club’s main expense, rose by 450% during the same period (Jones et al., 2012). This is a major factor in why the majority of EPL clubs struggle to generate profits. If a club is profitable or at least breaking even, it shows that they are prudent and controlling costs. Therefore a club’s net profit figure (after player trading) is included within the multivariate valuation model.
In the case of any company valuation, it is important to review all of the assets and liabilities of that organisation as is evident in the bankruptcy and broker valuation sections above.
This is no exception when it comes to football club valuation. The main assets of a club (typically a stadium, training ground and player registrations) need to be weighed up versus the liabilities (normally trade creditors and debt). A club’s net assets figure (total assets less total liabilities) is therefore included within the multivariate valuation model.
There are number of key performance indicators (KPIs) that relate specifically to the football industry. It was previously mentioned that broadcasting revenues are largely similar amongst EPL clubs. One area that this is not the case is match-day income.
For instance, Manchester United earned an average of £3.7m every home match-day in 2010/11 whilst Liverpool took in an average of £1.5m for every game at home13.
This is primarily down to Manchester United’s Old Trafford having a capacity of 75,765 in comparison to Liverpool’s Anfield only having 45,276.
This also illustrates the difference that stadium size and utilisation can make in terms of revenue in football. Therefore a club’s percentage stadium attendance is included within the multivariate valuation model as it illustrates how efficiently a club is utilising its stadium, one of its core revenue generating assets.
The fundamental KPI in the football industry in terms of cost management is what percentage of revenue is made up player wage expenditure.
It is commonly known as the wages to turnover ratio and a figure of 50% or less is seen as prudent. EPL clubs in 2010/11 had a combined wages to turnover ratio of 70% (Jones et al, 2012). As an established metric for club’s ability to control its biggest cost, the wages to turnover ratio is also included within the multivariate valuation model.
The motivation for the inclusion of each component in the multivariate model has been outlined in this section. The format of the model is below:
Club Valuation = (Revenue + Net Assets) x (Net Profit + Revenue) x (Stadium Capacity %) ÷ (Wage Ratio %)
Revenue
The rationale for the sequence of the variables will now be explained.
Revenue generation includes all the cash generated by the club in a financial year. It is extremely important within the football industry and the underpinning factor of UEFA and the EPL’s financial controls.
A club’s revenue figure is added to its net assets as these underpin a club’s ability to generate future revenue and consequently make up the backbone of the valuation model.
The net assets figure is made up of a club’s fixed assets added to current assets less current and long term liabilities taken from its audited financial statements.
The figure takes into consideration a club’s short and long term debt obligations. The combined revenue and net assets figure is multiplied by the club’s net profit (or loss) figure added
to revenue and divided by revenue. The figure examines a club’s profitability in comparison to its overall revenue. In the case of profitable clubs, the combined revenue and net assets will be multiplied by a figure greater than 1 to enhance the impending valuation in line with profits.
Whilst in loss making clubs it will be multiplied by a figure less than 1 to reduce the impending valuation in line with losses. The overall figure is then multiplied by the average stadium utilisation percentage which illustrates how effectively the club is using its core differentiating asset.
The higher stadium utilisation (up to a maximum of 100%), the higher the impending valuation. Finally, the overall figure is divided by a club’s wages to revenue ratio. This illustrates a club’s ability to control its major expenditure and the lower the percentage the higher the club’s final valuation.
The model is straightforward to calculate but not too simplistic like the revenue multiples technique. It uses audited accounting data and industry KPIs to provide a bespoke valuation method for an industry that is extremely dissimilar to the regular corporate domain.
The method also allows practical flexibility. It is possible to value a club for any contingency scenario such as European qualification or relegation from the EPL by adjusting the variables accordingly.
This is also applicable when valuing big spenders such as Chelsea and Manchester City where interest free debt can be removed from the net assets figure to reflect the true position of the clubs.
Table 1 compares the multivariate model’s EPL club valuations to the four other methods under evaluation in this paper.
Table 2 also compares multivariate model valuations to those of Forbes and actual transaction values of clubs sold between 2003/04 and 2011/12.
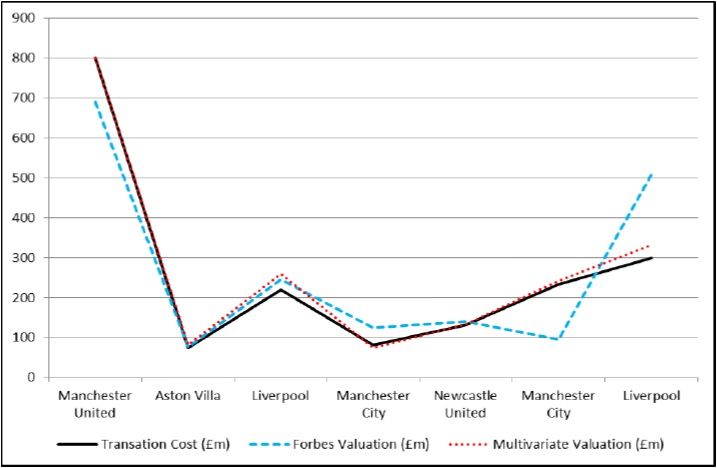
Table 3 compares the variations in the multivariate model and Forbes valuations to the actual club transaction values. Fig. 1 illustrates the correlation between the multivariate model, Forbes and actual transaction values.
Table 4 shows the EPL club valuation table for 2012 using the multivariate model.
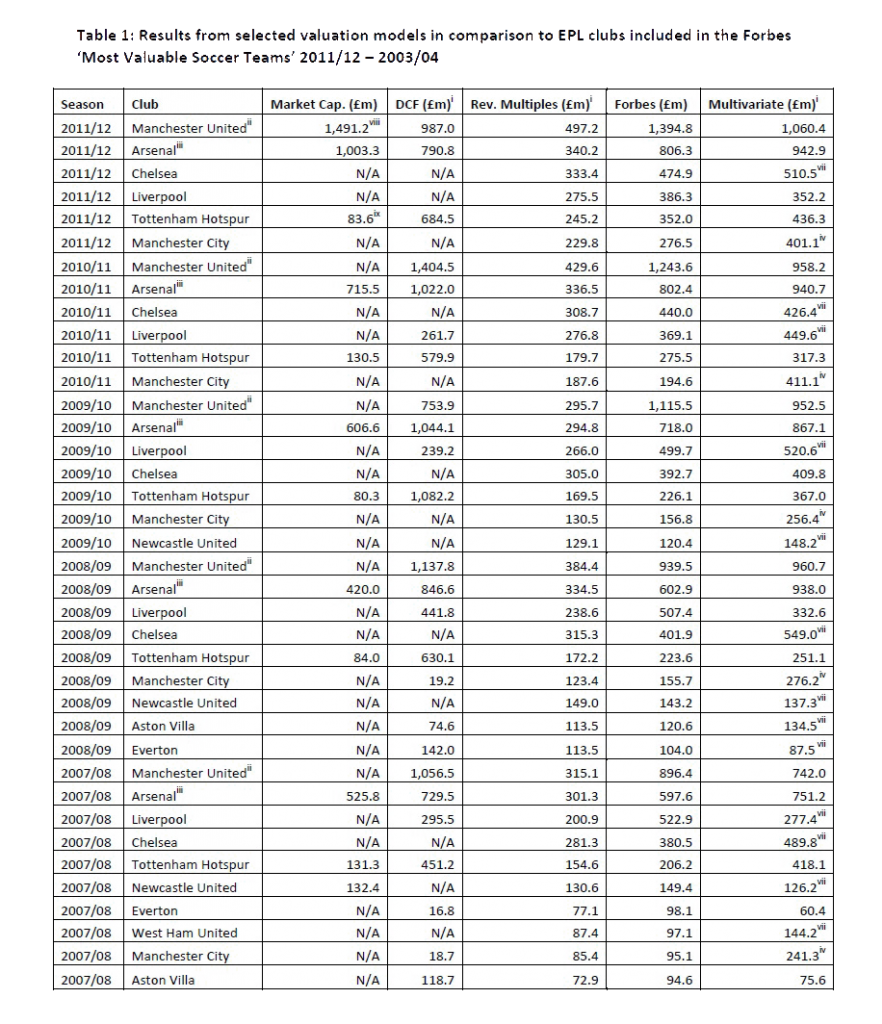
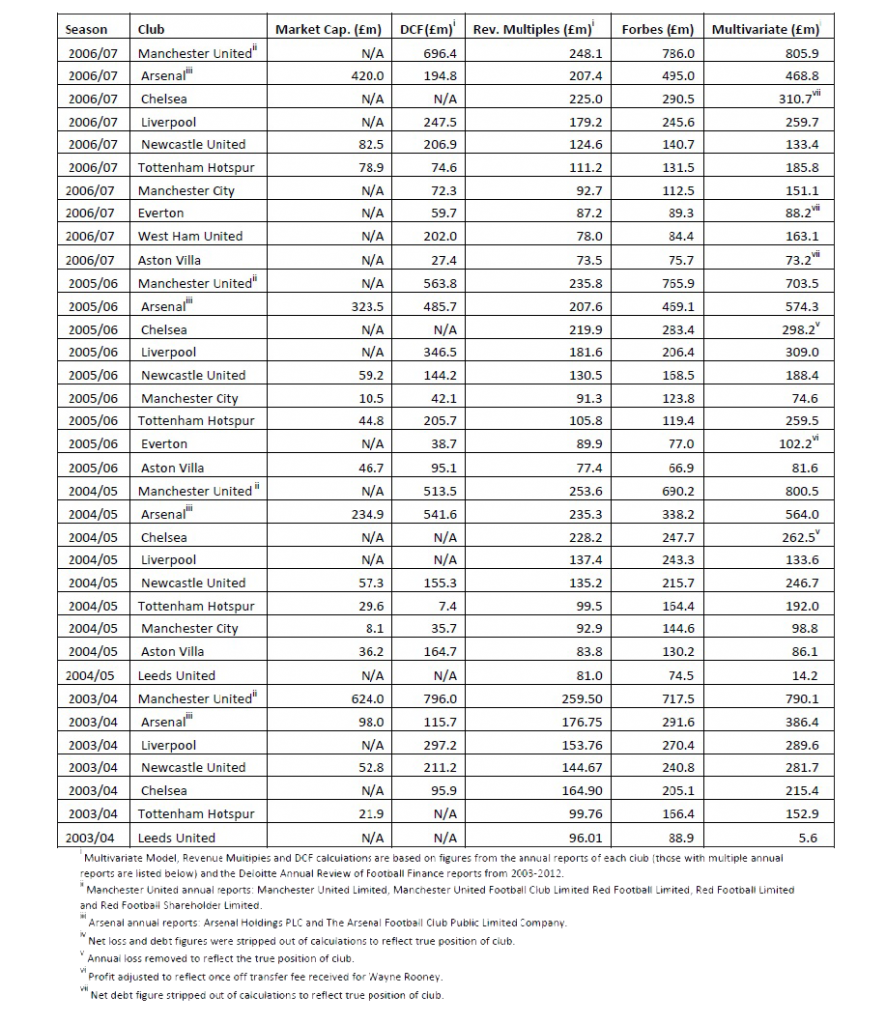
The objective of this paper is to establish the optimal method to value a football club. Table 1 compares the results of the five valuation methods outlined in the methodology section for the EPL clubs in Forbes ‘Most Valuable Soccer Teams’ in reverse chronological order between 2003/04 and 2011/12.
ix Tottenham Hotspur’s Market Capitalisation is based on the closing price on 13/01/012 – the club’s last day of trading in London.
viii Manchester United’s Market Capitalisation is based on the closing price on 10/08/12 – the club’s first day of trading in New York.
A valuation model needs to be reliable and universally applicable to football clubs in the EPL as a minimum requirement to be potentially considered as the optimal method to value a club.
This straight away causes a problem for the market capitalisation method as only two of the current twenty EPL clubs are listed (Arsenal) or partially listed (Manchester United) on an exchange.
This means that market capitalisation cannot be universally used to compare club valuations. It also proves somewhat erratic for club valuations from the evidence in Table 1.
For example, Tottenham Hotspur’s 2012 market capitalisation of £83.6m seems extremely undervalued especially given that midfielder Luka Modrić was sold by the club for £33.3m alone six months after this valuation.
The club is regularly profitable, owns its stadium and training ground in London and has a strong squad of players including the coveted Gareth Bale.
At the other end of the spectrum, Manchester United was valued at £1.49bn in 2012 which is £100m more than any other method calculated the club’s worth to be. Arsenal’s £1bn market capitalisation was the most realistic of the three figures for 2012 but the evidence from Table 1 shows the method cannot be universally adapted or relied upon to value clubs.
DCF is recognised to be the most dependable means of valuing a regular company. The shortcomings from football perspective are that it requires regular profitability and accurate predictions of future revenues to provide reliable valuations. The majority of EPL clubs are not profitable and cannot predict future financial performance due the volatility of a team’s on-field performance. Nevertheless, using the assumptions outlined in the methodology section it was possible to calculate the value of 53 of the 73 sample clubs in Table 1.
The results using DCF to calculate club values are mixed. There are examples of overvalued clubs in almost every season including: Tottenham Hotspur at £684.m in 2011/12, Manchester United at £1.4bn in 2010/11 and Tottenham Hotspur at £1bn in 2009/10.
There are also examples of distinct undervaluation including: Tottenham Hotspur at £7.4m, Manchester City at £8.1m in 2004/05 and Chelsea at £95.9m in 2003/04. It is therefore evident that DCF is neither consistently reliable nor universally applicable to valuing clubs in the EPL.
Table 1 also contains the club values attributed to the revenue multiples valuation method. This is the first technique under review that can be used to calculate the value of all clubs in the sample period between 2003/04 and 2011/12, but is it reliable?
The answer is no.
Although revenue multiples is recommended by academics and professionals in the sporting domain, the truth is that the methodology is far too simplistic.
The table shows that it tends to work adequately to provide a quick estimate for EPL clubs with lower revenue but provides large undervaluation for the more established clubs with higher revenues. Manchester United was sold for £800m in 2005 (Table 2) but the revenue multiple for the club in that year was £253.6m (Table 1).
This undervalues the club by over 68% and this is consistent for bigger clubs such as Manchester United, Arsenal, Liverpool and Tottenham Hotspur throughout the nine seasons under review. The method also fails to take into account what assets a club has under its control, its debt position, is it controlling costs and its profitability.
It is therefore evident that revenue multiples can be universally applied to value clubs in the EPL but its results are not consistently reliable.
This leaves two methods to examine: Forbes ‘Most Valuable Soccer Teams’ results and the multivariate model developed for this research paper.
Forbes has been publishing the twenty-five highest valued clubs in world football on an annual basis since 2004. These values are based on the magazine’s own valuation methodology which has evolved in recent seasons (see section 2.2.2). Table 1 was compiled only to include EPL clubs included in the Forbes lists between 2004 and 2012 as the magazine’s nebulous methodology could not be adopted to value any further EPL clubs.
This means that the Forbes method cannot be universally applied to EPL in an academic setting even though all clubs in the sample have a Forbes valuation.
At first glance at the Forbes results in Table 1 seem more credible than any of the previous methods examined. This probably explains why it has been the industry benchmark by default.
A comparison of sale transaction prices of North American sports franchises and Forbes valuations found that Forbes values were 27% higher than the actual sale prices (Vine, 2004).
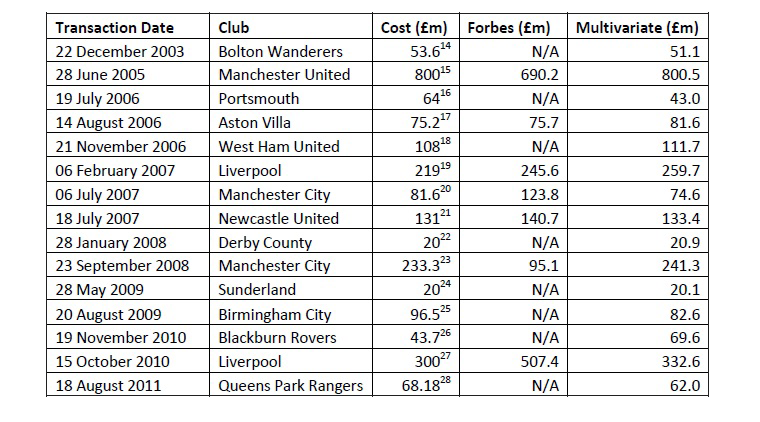
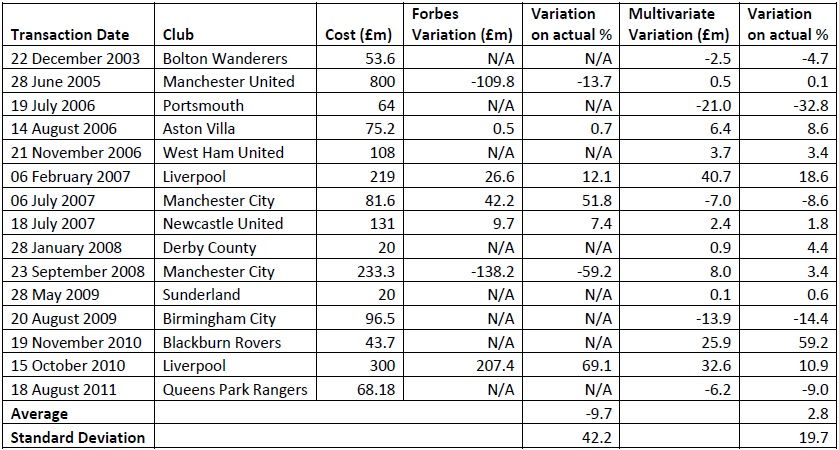
Tables 2 and 3 therefore compare the actual transaction values of EPL clubs (where over 51% of the club was sold) to Forbes valuations and the multivariate model between the sample seasons 2003/04 and 2011/12.
Table 2: Comparison of actual club sale values with Forbes and Multivariate valuations 2003/04 – 2011/12
Although there are only Forbes values available for seven of the fifteen transactions that took place during the sample period, it is evident that their results are even less reliable than those previously highlighted relating to US sports franchises.
Tables 2 and 3 show that Forbes estimates were between 59.2% lower (Manchester City in 2008) and 69.1% higher (Liverpool in 2010) than actual transaction prices.
Looking specifically at Manchester City which changed hands in 2007 and 2008, Forbes valued the club 51.8% higher than cost in 2007 and 59.2% lower than cost in 2008.
A standard deviation of 42.2 points to the fact that only two clubs were valued within 10% of the actual transaction cost by Forbes which illustrates that their method is not reliable or universally applicable to EPL clubs.
Table 3: Comparison of actual club sale values to variations of Forbes and Multivariate valuations with Average and Standard Deviation calculations 2003/04 – 2011/12
This leaves the multivariate model as the last to be considered.
The model uses audited accounting data and industry KPIs to provide a bespoke valuation method designed for the football industry.
This is evident on examination of the results from Tables 1, 2 and 3. Leeds United entered a period of financial distress between 2003 and 2005.
Table 1 shows that the multivariate model disclosed the club was almost worthless and in need of re-capitalisation whilst Forbes failed to recognise this along with the other valuation models.
In Table 2, the model correctly predicts that buyers overpaid for both Portsmouth and Birmingham City who were subsequently relegated. Table 3 reveals that on average valuations using the multivariate model were only 2.8% more than actual club transaction prices.
The valuations of Manchester United in 2005 and Sunderland in 2009 were exactly correct to the nearest million pounds. The Moores and Walker families who sold Liverpool in 2007 and Blackburn in 2009 respectively acknowledged that they sold at a lower price as they felt they were selling to new custodians who would propel the clubs forward which is evident in the multivariate models higher valuations for both clubs.
Fig. 1 highlights how close the multivariate model valuations are to actual club transactions in comparison to Forbes’ estimates. All this evidence suggests that the
multivariate model is the most reliable valuation model in this paper as well as being universally applicable to all EPL clubs.
Fig. 1: Correlation between actual club sale values with Forbes and Multivariate valuations 2003/04 – 2011/12
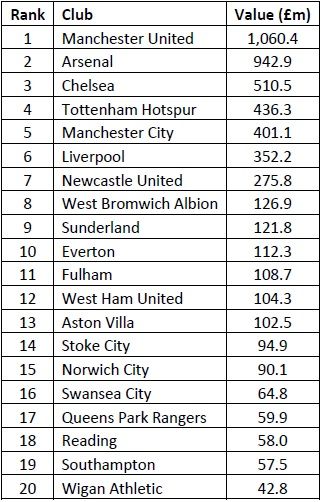
It is only fitting that the multivariate model is used to calculate an EPL club valuation table.
Table 4 reveals the 2012 values of the division’s twenty clubs.
Unsurprisingly, the commercially dominant Manchester United is top with a value of £1,060.4m.
Arsenal, the only club to be profitable for every sample season, is a close second at £942.9m; thanks mainly to the development of the Emirates stadium.
Chelsea with its smaller stadium and higher player wages is third at £510.5m. The consistently profitable Tottenham Hotspur is next with a value of £436.3m.
Big spenders, Manchester City come in at £401.1m. This valuation reflects the fact that Manchester City does not own its stadium and paid inflated player transfer fees and wages in recent seasons. English footballs most decorated club, Liverpool, is sixth with a value of £352.2m.
This value reflects the fact that Liverpool is earning approximately 40% of what Manchester United and Arsenal make on every match-day.
It will increase significantly when the club redevelops its Anfield stadium. Newcastle United is next at £275.8m based predominately on the club’s ability to fill St. James’ Park on a constant basis.
The prudent West Bromwich Albion is eighth at £126.9m. Sunderland is next with a value of £121.8m would could be improved upon by attracting more fans to the Stadium of Light.
In tenth place is Everton at £112.3m. Like city their rivals, a new stadium would significantly increase the value of Everton. Benefactor backed Fulham comes next at £108.7m.
West Ham United is twelfth at £104.3m but could be worth significantly more if the club remains in the EPL and successfully relocates into London’s Olympic Stadium.
Subsiding Aston Villa are worth £102.5m according to the model. Now consolidated in the EPL, Stoke City is next at £94.9m. Norwich City is valued at £90.1m. Strategic Swansea City is sixteenth at £64.8m.
Big spending Queen’s Park Rangers are valued at £59.9m. Reading, Southampton and Wigan Athletic make up the bottom three in the multivariate model valuation table at £58m, £57.5m and £42.8m respectively.
Table 4: 2012 EPL club valuations
6. Conclusion
This paper has introduced a new approach in the form of the multivariate model to calculate what an EPL club is worth. Prior to introducing the model, six established methodologies were assessed (and four calculated for the sample period) to examine if any could be universally applied to provide accurate valuations of EPL clubs.
The six methodologies were comprised of three general company valuation methods that have traditionally been used within corporate finance and three more specialised techniques used within the football sector to ascertain a club’s value.
Firstly it was shown that market capitalisation was not universally applicable to EPL clubs as only two clubs in the division are currently listed or partially listed on an exchange.
The authority of the values of those clubs using the technique was also questionable mainly due to a lack of liquidity in football shares.
The most established valuation technique, DCF, was then evaluated with regard to EPL clubs. The main stipulation of DCF is that it requires regular profitability and accurate predictions of future revenues to provide reliable valuations.
Most EPL clubs are consistently unprofitable and struggle to predict future financial performance due the volatility of a team on-field performance.
This rendered DCF unsuitable for universal and dependable valuation of clubs. The administration/liquidation process of valuing was also deemed inappropriate because it cannot be simulated and only one club has entered administration in the history of the EPL.
Revenue multiples provided erratic results in terms of EPL club valuations. Despite being recommended by a number of academics and professionals, it became apparent that the technique is far too simplistic.
It fails to consider a club’s assets, debt, ability to control costs and profitability and consequently provides unreliable club valuations.
Brokers will assess the assets and liabilities of a club to establish an approximate valuation of club but their core objective is to sell a club for the highest amount possible.
Similar to the administration/liquidation valuation of clubs, broker valuations cannot be simulated and therefore no calculations were made for comparison purposes in this research.
Forbes has become the benchmark metric for valuing clubs on the back of its ‘Most Valuable Soccer Teams’ feature that has been published annually since 2004.
The vague and evolving Forbes valuation methods meant that values could not be calculated for all the clubs in the EPL. The results section of this paper also highlights Forbes inconsistent valuation estimates in comparison to actual club transactions during the sample period.
So what is the optimal method to value a football club? The multivariate model introduced in this paper provides a universally applicable approach that can be used to value any club in the EPL. It also provides the most consistent and reliable results of any method examined in this research.
This is evident on reviewing the model’s valuations versus actual club transaction prices during the sample period. It is also flexible and allows club valuations to be amended in line with contingency scenarios which is critical given the unpredictable nature of football. The model represents an excellent guide in valuing EPL clubs.
There are a number of potential benefactors from the model. Firstly, as was evident in section 2, there is only a very limited amount of academic research in the area sports franchise valuation.
Consequently, this paper will build on the existing literature in this area whilst focusing on football club valuations in particular. Secondly, it is hard to believe that an industry that generated £2.9bn in England in 2010/11 does not a reliable valuation technique to value its core assets - the clubs (Jones et al., 2012).
A reliable valuation method is of benefit to: buyers, sellers, brokers, finance providers and club administrators. The research conducted in this paper could be extended to examine whether the multivariate model is applicable to value clubs in the English Football League, the Scottish Premier League and Football League, other European league clubs and major North American sports franchises.
................................................................. Source: Social Science Research Network